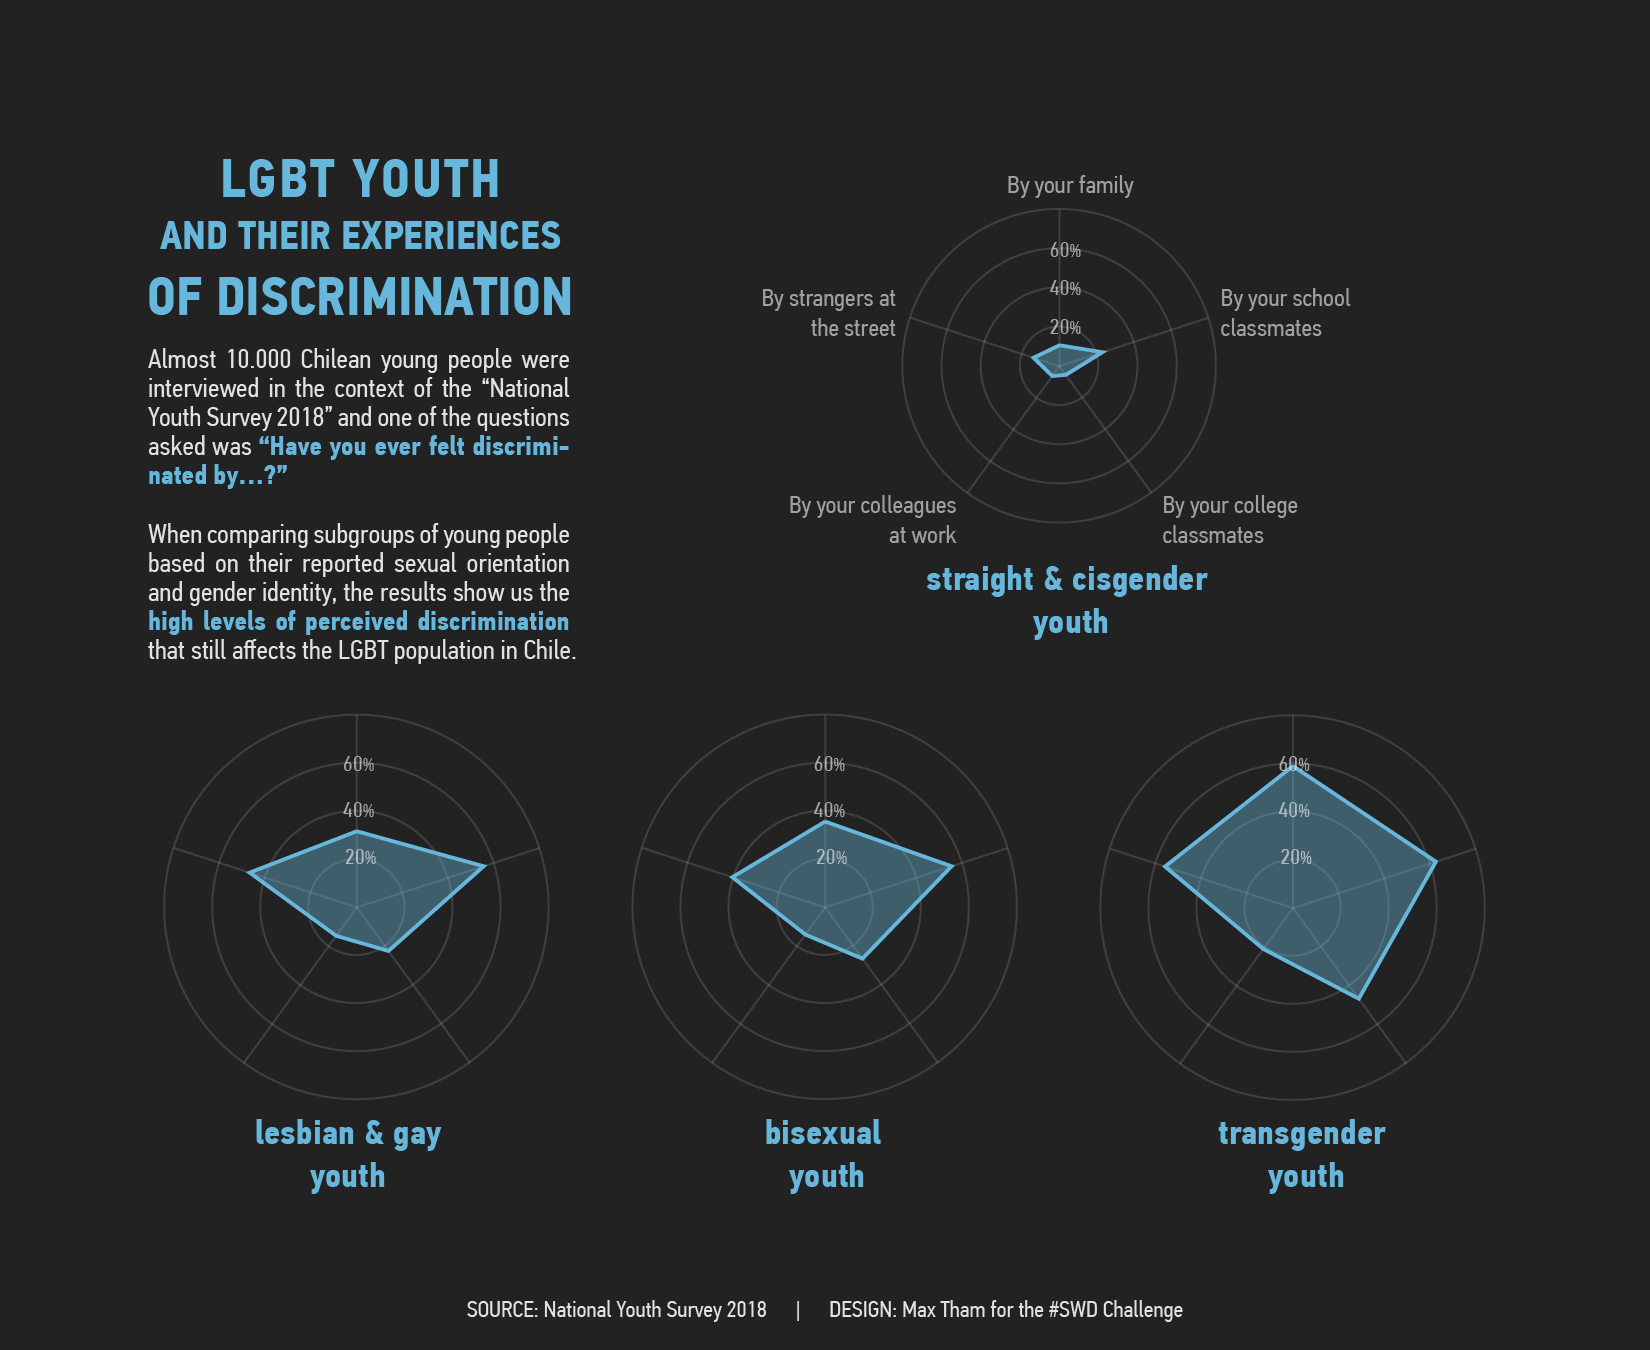
A quick viz to participate in the #StorytellingWithData January challenge. Probably not the best way to allow precise comparisons between groups, but after seeing some nice small multiples of radar charts I thought I could give it a try as an exercise.
The main point to convey visually is that for straight and cisgender youth the area covered by feelings of discrimination is very small, and for others it is much bigger.
The analysis is part of current research I am carrying on, where I study the experience of violence and discrimination that LGBT youth suffers, and how that relates to several indicators of subjective wellbeing.